Review


anti mouse foxm1  (Proteintech)


Bioz Verified Symbol Proteintech is a verified supplier  
  • Logo
  • About
  • News
  • Press Release
  • Team
  • Advisors
  • Partners
  • Contact
  • Bioz Stars
  • Bioz vStars
  • 96

    Structured Review

    Proteintech anti mouse foxm1
    A PGAM1-Chk1 antagonist suppresses <t>FOXM1</t> during senescence. a , b Assessment of the proapoptotic BH family in SnCs after Nutlin 3b treatment. a RT‒PCR analysis of SnCs with or without Nutlin 3b. ( n = 3, biological replicates). b p53 siRNA-transfected SnCs were exposed to Nutlin 3b. RT‒PCR analysis of the indicated cells. c Knockdown of BIM in SnCs. SnCs were transfected with the indicated siRNA, siBIM, or scramble control RNA. The transfectants were then subjected to Nutlin 3b treatment. d – f Comparison of the results of the microarray analysis between the control and Nutlin 3b-treated SnCs ( n = 3, biological replicates). d Fold enrichment analysis by comparison between 1168 genes downregulated by Nutlin 3b in SnCs and 9442 datasets of chromatin immunoprecipitation (ChIP) information reported in the National Center for Biotechnology Information (NCBI), European Bioinformatics Institute (EBI) and DNA Data Bank of Japan (DDBJ). Eighty-six of the 9442 datasets displayed high enrichment (>3-fold). Twenty-one datasets for FOXM1 are shown in red (left panel). e Heatmap of 37 FOXM1 target genes downregulated by Nutlin 3b. SnCs with or without Nutlin 3b were compared. f Gene expression of the FOX family in SnCs after Nutlin 3b treatment, as determined via microarray data. Left panel, heatmap analysis of the FOX family. Right panel: Red and blue bars indicate reduced and increased expression, respectively. Dagger (†) indicates |FC|≥2 and Lpe. P < 0.05 is presented in Supplementary Fig. . Evaluation of <t>FOXM1</t> <t>protein</t> levels in SnCs after Nutlin 3b treatment ( g ) and after transfection with HIF-2α siRNA ( h ). The data are representative of two independent experiments. i Evaluation of BIM mRNA in SnCs after FOXM1 knockdown. FOXM1 siRNA was transfected into SnCs ( n = 3, biological replicates). j Schematic diagram of the promoter region in the human BIM gene. Several cis-elements for FKH are shown. The indicated regions were subsequently cloned and inserted into luciferase reporter plasmids (left lower panel). Luciferase reporter assays were performed in SnCs after Nutlin 3b treatment (middle panel). A reporter assay for the proximal region was conducted in SnCs after FOXM1 knockdown (right panel) ( n = 3, biological replicates). The data represent the means ± SEMs. Single (*) and double (**) asterisks indicate statistical significance at p < 0.05 and p < 0.01, respectively. Statistical analyses were performed via unpaired Student’s two-tailed t test ( a ) or one-way analysis of variance (ANOVA) and Dunnett’s multiple comparison test ( b , c , i and j )
    Anti Mouse Foxm1, supplied by Proteintech, used in various techniques. Bioz Stars score: 96/100, based on 130 PubMed citations. ZERO BIAS - scores, article reviews, protocol conditions and more
    https://www.bioz.com/result/anti mouse foxm1/product/Proteintech
    Average 96 stars, based on 130 article reviews
    anti mouse foxm1 - by Bioz Stars, 2026-03
    96/100 stars

    Images

    1) Product Images from "Abrogation of aberrant glycolytic interactions eliminates senescent cells and alleviates aging-related dysfunctions"

    Article Title: Abrogation of aberrant glycolytic interactions eliminates senescent cells and alleviates aging-related dysfunctions

    Journal: Signal Transduction and Targeted Therapy

    doi: 10.1038/s41392-025-02502-6

    A PGAM1-Chk1 antagonist suppresses FOXM1 during senescence. a , b Assessment of the proapoptotic BH family in SnCs after Nutlin 3b treatment. a RT‒PCR analysis of SnCs with or without Nutlin 3b. ( n = 3, biological replicates). b p53 siRNA-transfected SnCs were exposed to Nutlin 3b. RT‒PCR analysis of the indicated cells. c Knockdown of BIM in SnCs. SnCs were transfected with the indicated siRNA, siBIM, or scramble control RNA. The transfectants were then subjected to Nutlin 3b treatment. d – f Comparison of the results of the microarray analysis between the control and Nutlin 3b-treated SnCs ( n = 3, biological replicates). d Fold enrichment analysis by comparison between 1168 genes downregulated by Nutlin 3b in SnCs and 9442 datasets of chromatin immunoprecipitation (ChIP) information reported in the National Center for Biotechnology Information (NCBI), European Bioinformatics Institute (EBI) and DNA Data Bank of Japan (DDBJ). Eighty-six of the 9442 datasets displayed high enrichment (>3-fold). Twenty-one datasets for FOXM1 are shown in red (left panel). e Heatmap of 37 FOXM1 target genes downregulated by Nutlin 3b. SnCs with or without Nutlin 3b were compared. f Gene expression of the FOX family in SnCs after Nutlin 3b treatment, as determined via microarray data. Left panel, heatmap analysis of the FOX family. Right panel: Red and blue bars indicate reduced and increased expression, respectively. Dagger (†) indicates |FC|≥2 and Lpe. P < 0.05 is presented in Supplementary Fig. . Evaluation of FOXM1 protein levels in SnCs after Nutlin 3b treatment ( g ) and after transfection with HIF-2α siRNA ( h ). The data are representative of two independent experiments. i Evaluation of BIM mRNA in SnCs after FOXM1 knockdown. FOXM1 siRNA was transfected into SnCs ( n = 3, biological replicates). j Schematic diagram of the promoter region in the human BIM gene. Several cis-elements for FKH are shown. The indicated regions were subsequently cloned and inserted into luciferase reporter plasmids (left lower panel). Luciferase reporter assays were performed in SnCs after Nutlin 3b treatment (middle panel). A reporter assay for the proximal region was conducted in SnCs after FOXM1 knockdown (right panel) ( n = 3, biological replicates). The data represent the means ± SEMs. Single (*) and double (**) asterisks indicate statistical significance at p < 0.05 and p < 0.01, respectively. Statistical analyses were performed via unpaired Student’s two-tailed t test ( a ) or one-way analysis of variance (ANOVA) and Dunnett’s multiple comparison test ( b , c , i and j )
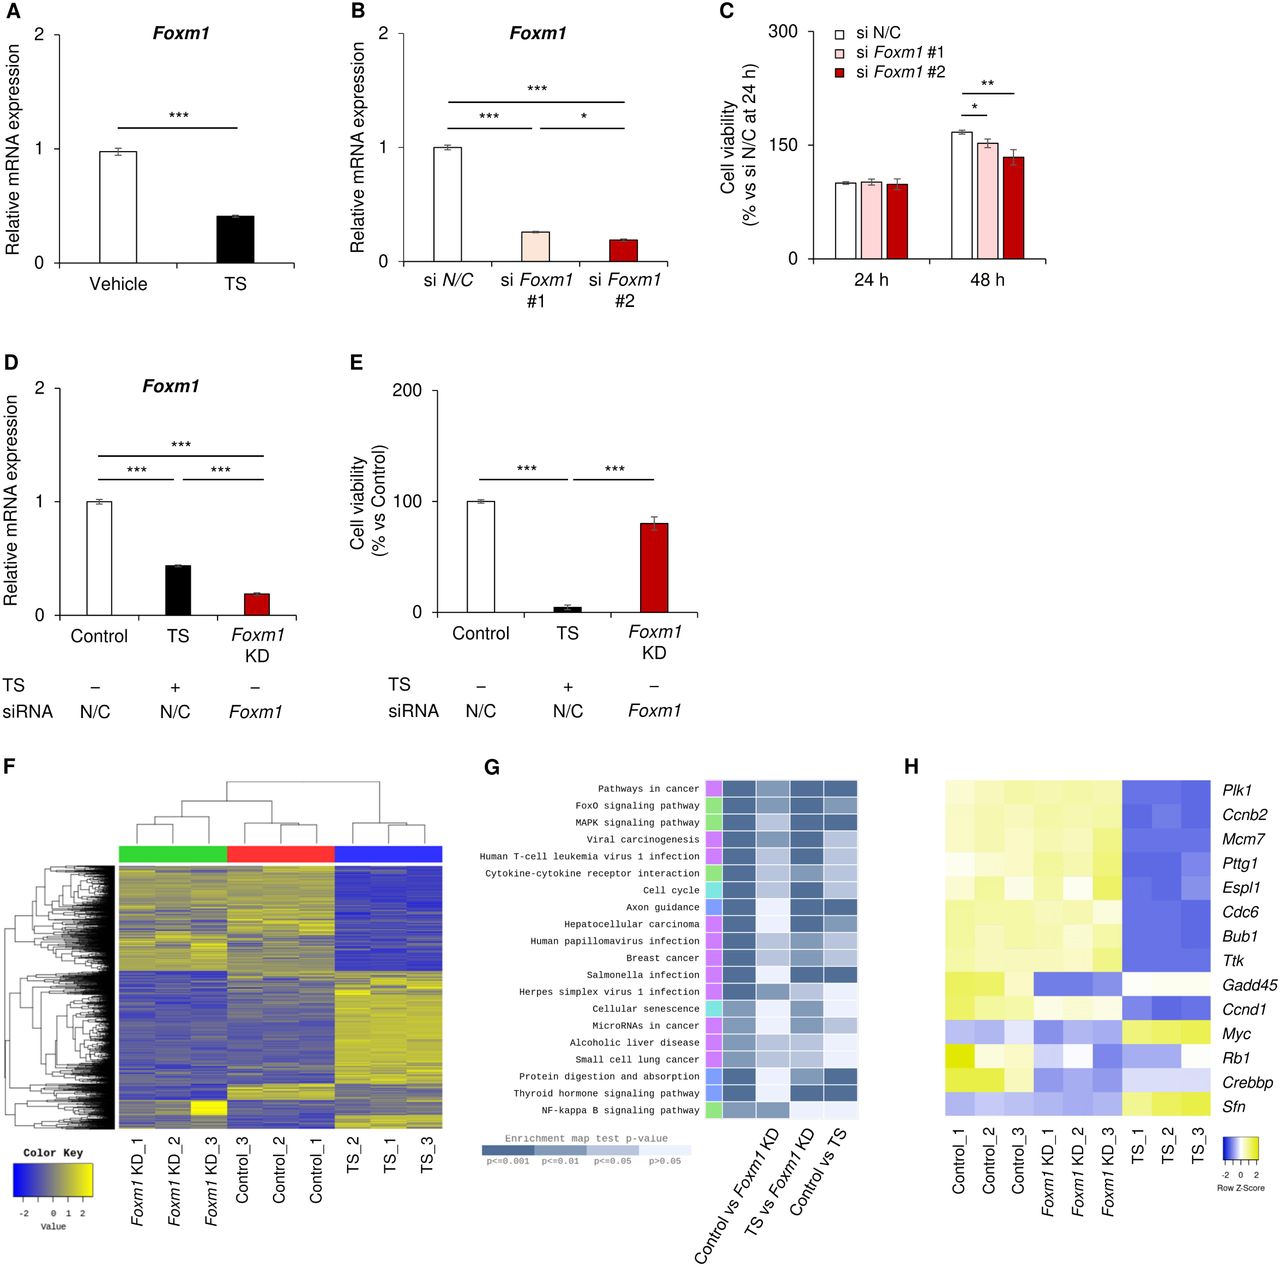
    Figure Legend Snippet: A PGAM1-Chk1 antagonist suppresses FOXM1 during senescence. a , b Assessment of the proapoptotic BH family in SnCs after Nutlin 3b treatment. a RT‒PCR analysis of SnCs with or without Nutlin 3b. ( n = 3, biological replicates). b p53 siRNA-transfected SnCs were exposed to Nutlin 3b. RT‒PCR analysis of the indicated cells. c Knockdown of BIM in SnCs. SnCs were transfected with the indicated siRNA, siBIM, or scramble control RNA. The transfectants were then subjected to Nutlin 3b treatment. d – f Comparison of the results of the microarray analysis between the control and Nutlin 3b-treated SnCs ( n = 3, biological replicates). d Fold enrichment analysis by comparison between 1168 genes downregulated by Nutlin 3b in SnCs and 9442 datasets of chromatin immunoprecipitation (ChIP) information reported in the National Center for Biotechnology Information (NCBI), European Bioinformatics Institute (EBI) and DNA Data Bank of Japan (DDBJ). Eighty-six of the 9442 datasets displayed high enrichment (>3-fold). Twenty-one datasets for FOXM1 are shown in red (left panel). e Heatmap of 37 FOXM1 target genes downregulated by Nutlin 3b. SnCs with or without Nutlin 3b were compared. f Gene expression of the FOX family in SnCs after Nutlin 3b treatment, as determined via microarray data. Left panel, heatmap analysis of the FOX family. Right panel: Red and blue bars indicate reduced and increased expression, respectively. Dagger (†) indicates |FC|≥2 and Lpe. P < 0.05 is presented in Supplementary Fig. . Evaluation of FOXM1 protein levels in SnCs after Nutlin 3b treatment ( g ) and after transfection with HIF-2α siRNA ( h ). The data are representative of two independent experiments. i Evaluation of BIM mRNA in SnCs after FOXM1 knockdown. FOXM1 siRNA was transfected into SnCs ( n = 3, biological replicates). j Schematic diagram of the promoter region in the human BIM gene. Several cis-elements for FKH are shown. The indicated regions were subsequently cloned and inserted into luciferase reporter plasmids (left lower panel). Luciferase reporter assays were performed in SnCs after Nutlin 3b treatment (middle panel). A reporter assay for the proximal region was conducted in SnCs after FOXM1 knockdown (right panel) ( n = 3, biological replicates). The data represent the means ± SEMs. Single (*) and double (**) asterisks indicate statistical significance at p < 0.05 and p < 0.01, respectively. Statistical analyses were performed via unpaired Student’s two-tailed t test ( a ) or one-way analysis of variance (ANOVA) and Dunnett’s multiple comparison test ( b , c , i and j )

    Techniques Used: Transfection, Knockdown, Control, Comparison, Microarray, Chromatin Immunoprecipitation, Gene Expression, Expressing, Clone Assay, Luciferase, Reporter Assay, Two Tailed Test

    In vivo FOXM1 accumulation in aged tissues is targeted by Nutlin 3b. a In vivo profiles of FOXM1 mRNA in several tissues of 4-, 10-, 40- and 90-week-old mice, in addition to embryos on day 13.5. The indicated tissues were collected for RNA extraction. b Fold enrichment analysis comparing upregulated genes in 90-week-old mice (liver: 1039; kidney: 1882; lung: 386; and WAT: 385) and ChIP datasets (liver: 9649; kidney: 11,195; lung: 6147; and WAT: 6059). Comparative transcriptomic analysis of the indicated tissues, liver, lung, kidney, and WAT, was performed between 10-week-old and 90-week-old mice. c Heatmap analysis of FOXM1 target genes in the kidney and lung (left and right panels) of young (10-week-old) and aged (90-week-old) mice. d Assessment of FOXM1 target genes involved in the cell cycle and DNA repair genes in aged kidneys and lungs (upper and lower panels, respectively) after Nutlin 3b treatment via RT‒PCR analysis. Tissues were collected from young (10-week-old), aged (90-week-old) and Nutlin 3b-treated aged mice. e The impact of Nutlin-3b on aged kidneys. Representative pictures of the glomerulus after Nutlin 3b treatment (upper panels). Samples from young, aged and Nutlin 3b-treated aged mice. The bar indicates 50 μm. Hyalinosis scores were assessed in aged mice with or without Nutlin 3b treatment. Glomerulus region (lower left) and interstitial region (lower right). f Immunohistochemical examination of the lung for p21 CIP1 . Representative images of stained samples from the indicated mice are shown (left panels). The bar indicates 20 μm. The ratio of p21 CIP1 -positive cells was assessed (right panel). g Comparison of the mRNA levels of p16 Ink4a and SASP factors (Il6, Tnfα, Cxcl1, and Ccl5). Lung extracts from the indicated mice were analyzed via RT‒PCR. The data represent the means ± SEMs. Single (*) and double (**) asterisks indicate statistical significance at p < 0.05 and p < 0.01, respectively. Statistical analyses were performed via one-way analysis of variance (ANOVA) and Dunnett’s multiple comparison test
    Figure Legend Snippet: In vivo FOXM1 accumulation in aged tissues is targeted by Nutlin 3b. a In vivo profiles of FOXM1 mRNA in several tissues of 4-, 10-, 40- and 90-week-old mice, in addition to embryos on day 13.5. The indicated tissues were collected for RNA extraction. b Fold enrichment analysis comparing upregulated genes in 90-week-old mice (liver: 1039; kidney: 1882; lung: 386; and WAT: 385) and ChIP datasets (liver: 9649; kidney: 11,195; lung: 6147; and WAT: 6059). Comparative transcriptomic analysis of the indicated tissues, liver, lung, kidney, and WAT, was performed between 10-week-old and 90-week-old mice. c Heatmap analysis of FOXM1 target genes in the kidney and lung (left and right panels) of young (10-week-old) and aged (90-week-old) mice. d Assessment of FOXM1 target genes involved in the cell cycle and DNA repair genes in aged kidneys and lungs (upper and lower panels, respectively) after Nutlin 3b treatment via RT‒PCR analysis. Tissues were collected from young (10-week-old), aged (90-week-old) and Nutlin 3b-treated aged mice. e The impact of Nutlin-3b on aged kidneys. Representative pictures of the glomerulus after Nutlin 3b treatment (upper panels). Samples from young, aged and Nutlin 3b-treated aged mice. The bar indicates 50 μm. Hyalinosis scores were assessed in aged mice with or without Nutlin 3b treatment. Glomerulus region (lower left) and interstitial region (lower right). f Immunohistochemical examination of the lung for p21 CIP1 . Representative images of stained samples from the indicated mice are shown (left panels). The bar indicates 20 μm. The ratio of p21 CIP1 -positive cells was assessed (right panel). g Comparison of the mRNA levels of p16 Ink4a and SASP factors (Il6, Tnfα, Cxcl1, and Ccl5). Lung extracts from the indicated mice were analyzed via RT‒PCR. The data represent the means ± SEMs. Single (*) and double (**) asterisks indicate statistical significance at p < 0.05 and p < 0.01, respectively. Statistical analyses were performed via one-way analysis of variance (ANOVA) and Dunnett’s multiple comparison test

    Techniques Used: In Vivo, RNA Extraction, Immunohistochemical staining, Staining, Comparison


    Similar Products

    96
    Proteintech anti mouse foxm1
    A PGAM1-Chk1 antagonist suppresses <t>FOXM1</t> during senescence. a , b Assessment of the proapoptotic BH family in SnCs after Nutlin 3b treatment. a RT‒PCR analysis of SnCs with or without Nutlin 3b. ( n = 3, biological replicates). b p53 siRNA-transfected SnCs were exposed to Nutlin 3b. RT‒PCR analysis of the indicated cells. c Knockdown of BIM in SnCs. SnCs were transfected with the indicated siRNA, siBIM, or scramble control RNA. The transfectants were then subjected to Nutlin 3b treatment. d – f Comparison of the results of the microarray analysis between the control and Nutlin 3b-treated SnCs ( n = 3, biological replicates). d Fold enrichment analysis by comparison between 1168 genes downregulated by Nutlin 3b in SnCs and 9442 datasets of chromatin immunoprecipitation (ChIP) information reported in the National Center for Biotechnology Information (NCBI), European Bioinformatics Institute (EBI) and DNA Data Bank of Japan (DDBJ). Eighty-six of the 9442 datasets displayed high enrichment (>3-fold). Twenty-one datasets for FOXM1 are shown in red (left panel). e Heatmap of 37 FOXM1 target genes downregulated by Nutlin 3b. SnCs with or without Nutlin 3b were compared. f Gene expression of the FOX family in SnCs after Nutlin 3b treatment, as determined via microarray data. Left panel, heatmap analysis of the FOX family. Right panel: Red and blue bars indicate reduced and increased expression, respectively. Dagger (†) indicates |FC|≥2 and Lpe. P < 0.05 is presented in Supplementary Fig. . Evaluation of <t>FOXM1</t> <t>protein</t> levels in SnCs after Nutlin 3b treatment ( g ) and after transfection with HIF-2α siRNA ( h ). The data are representative of two independent experiments. i Evaluation of BIM mRNA in SnCs after FOXM1 knockdown. FOXM1 siRNA was transfected into SnCs ( n = 3, biological replicates). j Schematic diagram of the promoter region in the human BIM gene. Several cis-elements for FKH are shown. The indicated regions were subsequently cloned and inserted into luciferase reporter plasmids (left lower panel). Luciferase reporter assays were performed in SnCs after Nutlin 3b treatment (middle panel). A reporter assay for the proximal region was conducted in SnCs after FOXM1 knockdown (right panel) ( n = 3, biological replicates). The data represent the means ± SEMs. Single (*) and double (**) asterisks indicate statistical significance at p < 0.05 and p < 0.01, respectively. Statistical analyses were performed via unpaired Student’s two-tailed t test ( a ) or one-way analysis of variance (ANOVA) and Dunnett’s multiple comparison test ( b , c , i and j )
    Anti Mouse Foxm1, supplied by Proteintech, used in various techniques. Bioz Stars score: 96/100, based on 1 PubMed citations. ZERO BIAS - scores, article reviews, protocol conditions and more
    https://www.bioz.com/result/anti mouse foxm1/product/Proteintech
    Average 96 stars, based on 1 article reviews
    anti mouse foxm1 - by Bioz Stars, 2026-03
    96/100 stars
      Buy from Supplier

    96
    Proteintech mouse anti rrm2 mab
    A PGAM1-Chk1 antagonist suppresses <t>FOXM1</t> during senescence. a , b Assessment of the proapoptotic BH family in SnCs after Nutlin 3b treatment. a RT‒PCR analysis of SnCs with or without Nutlin 3b. ( n = 3, biological replicates). b p53 siRNA-transfected SnCs were exposed to Nutlin 3b. RT‒PCR analysis of the indicated cells. c Knockdown of BIM in SnCs. SnCs were transfected with the indicated siRNA, siBIM, or scramble control RNA. The transfectants were then subjected to Nutlin 3b treatment. d – f Comparison of the results of the microarray analysis between the control and Nutlin 3b-treated SnCs ( n = 3, biological replicates). d Fold enrichment analysis by comparison between 1168 genes downregulated by Nutlin 3b in SnCs and 9442 datasets of chromatin immunoprecipitation (ChIP) information reported in the National Center for Biotechnology Information (NCBI), European Bioinformatics Institute (EBI) and DNA Data Bank of Japan (DDBJ). Eighty-six of the 9442 datasets displayed high enrichment (>3-fold). Twenty-one datasets for FOXM1 are shown in red (left panel). e Heatmap of 37 FOXM1 target genes downregulated by Nutlin 3b. SnCs with or without Nutlin 3b were compared. f Gene expression of the FOX family in SnCs after Nutlin 3b treatment, as determined via microarray data. Left panel, heatmap analysis of the FOX family. Right panel: Red and blue bars indicate reduced and increased expression, respectively. Dagger (†) indicates |FC|≥2 and Lpe. P < 0.05 is presented in Supplementary Fig. . Evaluation of <t>FOXM1</t> <t>protein</t> levels in SnCs after Nutlin 3b treatment ( g ) and after transfection with HIF-2α siRNA ( h ). The data are representative of two independent experiments. i Evaluation of BIM mRNA in SnCs after FOXM1 knockdown. FOXM1 siRNA was transfected into SnCs ( n = 3, biological replicates). j Schematic diagram of the promoter region in the human BIM gene. Several cis-elements for FKH are shown. The indicated regions were subsequently cloned and inserted into luciferase reporter plasmids (left lower panel). Luciferase reporter assays were performed in SnCs after Nutlin 3b treatment (middle panel). A reporter assay for the proximal region was conducted in SnCs after FOXM1 knockdown (right panel) ( n = 3, biological replicates). The data represent the means ± SEMs. Single (*) and double (**) asterisks indicate statistical significance at p < 0.05 and p < 0.01, respectively. Statistical analyses were performed via unpaired Student’s two-tailed t test ( a ) or one-way analysis of variance (ANOVA) and Dunnett’s multiple comparison test ( b , c , i and j )
    Mouse Anti Rrm2 Mab, supplied by Proteintech, used in various techniques. Bioz Stars score: 96/100, based on 1 PubMed citations. ZERO BIAS - scores, article reviews, protocol conditions and more
    https://www.bioz.com/result/mouse anti rrm2 mab/product/Proteintech
    Average 96 stars, based on 1 article reviews
    mouse anti rrm2 mab - by Bioz Stars, 2026-03
    96/100 stars
      Buy from Supplier

    97
    Santa Cruz Biotechnology foxm1 mouse monoclonal antibodies
    FIGURE 1 SIRT2 and <t>FOXM1</t> immunostaining and correlation in human colon cancer. (A) Representation images of the strong, moderate, and weak SIRT2 (upper panel) and FOXM1 (lower panel) staining of colon tissue sections from the same tumors were presented. Samples were counterstained with hematoxylin and scored semi‐quantifiably according to staining intensities. Bar = 100 μm. *Independent‐Samples t‐test, **Pearson Chi‐Square. (B) Correlation between SIRT2 and FOXM1 gene expressions. Gene expressions were obtained from TCGA‐COAD Project Database and correlation was analyzed with Spearman's rho. A negative Spearman correlation (−0.3084) was found between the genes (p < 0.001).
    Foxm1 Mouse Monoclonal Antibodies, supplied by Santa Cruz Biotechnology, used in various techniques. Bioz Stars score: 97/100, based on 1 PubMed citations. ZERO BIAS - scores, article reviews, protocol conditions and more
    https://www.bioz.com/result/foxm1 mouse monoclonal antibodies/product/Santa Cruz Biotechnology
    Average 97 stars, based on 1 article reviews
    foxm1 mouse monoclonal antibodies - by Bioz Stars, 2026-03
    97/100 stars
      Buy from Supplier

    97
    Santa Cruz Biotechnology mouse monoclonal anti foxm1 antibody
    (A) Quantitative RT-PCR of <t>Foxm1</t> mRNA in AtT-20 cells treated with 2 μM TS for 24 h. n = 6 each. (B, C) Quantitative RT-PCR of Foxm1 mRNA (B) and cell viability (C) of AtT-20 cells with Foxm1 knockdown (KD) by transfection with short interfering RNA (siRNA). A negative control siRNA (si N/C) was used, along with two siRNAs for Foxm1 (si Foxm1 #1 and si Foxm1 #2). RNA samples were collected after 24 h and cell viability was evaluated at both 24 and 48 h after transfections. Results are shown as the ratio relative to si N/C at 24 h. n = 6 each. (D, E) Quantitative RT-PCR of Foxm1 mRNA (D) and cell viability (E) of AtT-20 cells treated with TS and/or with Foxm1 knockdown. The Control group was treated with vehicle and transfected with si N/C, the TS group with 2 μM TS and si N/C, and the Foxm1 KD group with vehicle and si Foxm1 #2. n = 6 each. (F–H) Results of RNA-sequencing (RNA-seq) using RNA samples obtained in the experiments shown in panels D and E. Samples were analyzed as a mix of every two samples. n = 3 each. Panels F–H show hierarchical clustering (F), the top 20 terms from the enrichment analysis by the Kyoto Encyclopedia of Genes and Genomes (KEGG) (G), and DEGs associated with the cell cycle pathway in KEGG (H). DEGs were determined as an adjusted p < 0.05 and fold changes ≤ −2 or ≥ 2. Data of quantitative RT-PCR are normalized by means of Actb and Gapdh . Data are represented as means ± SEM. Statistical analyses were performed using the Student’s t -test for a panel A, and ANOVA followed by the Tukey-Kramer test for panels B–E. The p -value is presented as * p < 0.05, ** p < 0.01, and *** p < 0.001.
    Mouse Monoclonal Anti Foxm1 Antibody, supplied by Santa Cruz Biotechnology, used in various techniques. Bioz Stars score: 97/100, based on 1 PubMed citations. ZERO BIAS - scores, article reviews, protocol conditions and more
    https://www.bioz.com/result/mouse monoclonal anti foxm1 antibody/product/Santa Cruz Biotechnology
    Average 97 stars, based on 1 article reviews
    mouse monoclonal anti foxm1 antibody - by Bioz Stars, 2026-03
    97/100 stars
      Buy from Supplier

    97
    Santa Cruz Biotechnology mouse anti foxm1
    (A) Quantitative RT-PCR of <t>Foxm1</t> mRNA in AtT-20 cells treated with 2 μM TS for 24 h. n = 6 each. (B, C) Quantitative RT-PCR of Foxm1 mRNA (B) and cell viability (C) of AtT-20 cells with Foxm1 knockdown (KD) by transfection with short interfering RNA (siRNA). A negative control siRNA (si N/C) was used, along with two siRNAs for Foxm1 (si Foxm1 #1 and si Foxm1 #2). RNA samples were collected after 24 h and cell viability was evaluated at both 24 and 48 h after transfections. Results are shown as the ratio relative to si N/C at 24 h. n = 6 each. (D, E) Quantitative RT-PCR of Foxm1 mRNA (D) and cell viability (E) of AtT-20 cells treated with TS and/or with Foxm1 knockdown. The Control group was treated with vehicle and transfected with si N/C, the TS group with 2 μM TS and si N/C, and the Foxm1 KD group with vehicle and si Foxm1 #2. n = 6 each. (F–H) Results of RNA-sequencing (RNA-seq) using RNA samples obtained in the experiments shown in panels D and E. Samples were analyzed as a mix of every two samples. n = 3 each. Panels F–H show hierarchical clustering (F), the top 20 terms from the enrichment analysis by the Kyoto Encyclopedia of Genes and Genomes (KEGG) (G), and DEGs associated with the cell cycle pathway in KEGG (H). DEGs were determined as an adjusted p < 0.05 and fold changes ≤ −2 or ≥ 2. Data of quantitative RT-PCR are normalized by means of Actb and Gapdh . Data are represented as means ± SEM. Statistical analyses were performed using the Student’s t -test for a panel A, and ANOVA followed by the Tukey-Kramer test for panels B–E. The p -value is presented as * p < 0.05, ** p < 0.01, and *** p < 0.001.
    Mouse Anti Foxm1, supplied by Santa Cruz Biotechnology, used in various techniques. Bioz Stars score: 97/100, based on 1 PubMed citations. ZERO BIAS - scores, article reviews, protocol conditions and more
    https://www.bioz.com/result/mouse anti foxm1/product/Santa Cruz Biotechnology
    Average 97 stars, based on 1 article reviews
    mouse anti foxm1 - by Bioz Stars, 2026-03
    97/100 stars
      Buy from Supplier

    90
    Millipore mouse anti-foxm1 antibody
    ( A ) Diagram highlighting how gliomaspheres were isolated and transformed for analysis and also reimplanted using a 1:10 dilution into fresh organoids. ( B ) Gliomaspheres and organoid fractions isolated ± LonP1 overexpression were analyzed by western blot for PMT marker levels or ( C ) assessed for resistance to TMZ. ( D ) LonP1 overexpressing DB76 gliomaspheres were diluted 1:10 with untransformed gliomaspheres prior to reimplantation and immunofluorescence analysis of <t>FOXM1</t> in new organoids. Statistical significance was determined by t-test. * P <0.05, **P <0.01, ***P <0.001; n.s., not significant.
    Mouse Anti Foxm1 Antibody, supplied by Millipore, used in various techniques. Bioz Stars score: 90/100, based on 1 PubMed citations. ZERO BIAS - scores, article reviews, protocol conditions and more
    https://www.bioz.com/result/mouse anti-foxm1 antibody/product/Millipore
    Average 90 stars, based on 1 article reviews
    mouse anti-foxm1 antibody - by Bioz Stars, 2026-03
    90/100 stars
      Buy from Supplier

    97
    Santa Cruz Biotechnology mouse monoclonal foxm1 g 5
    ( A ) Diagram highlighting how gliomaspheres were isolated and transformed for analysis and also reimplanted using a 1:10 dilution into fresh organoids. ( B ) Gliomaspheres and organoid fractions isolated ± LonP1 overexpression were analyzed by western blot for PMT marker levels or ( C ) assessed for resistance to TMZ. ( D ) LonP1 overexpressing DB76 gliomaspheres were diluted 1:10 with untransformed gliomaspheres prior to reimplantation and immunofluorescence analysis of <t>FOXM1</t> in new organoids. Statistical significance was determined by t-test. * P <0.05, **P <0.01, ***P <0.001; n.s., not significant.
    Mouse Monoclonal Foxm1 G 5, supplied by Santa Cruz Biotechnology, used in various techniques. Bioz Stars score: 97/100, based on 1 PubMed citations. ZERO BIAS - scores, article reviews, protocol conditions and more
    https://www.bioz.com/result/mouse monoclonal foxm1 g 5/product/Santa Cruz Biotechnology
    Average 97 stars, based on 1 article reviews
    mouse monoclonal foxm1 g 5 - by Bioz Stars, 2026-03
    97/100 stars
      Buy from Supplier

    97
    Santa Cruz Biotechnology monoclonal mouse anti foxm1
    ( A ) Diagram highlighting how gliomaspheres were isolated and transformed for analysis and also reimplanted using a 1:10 dilution into fresh organoids. ( B ) Gliomaspheres and organoid fractions isolated ± LonP1 overexpression were analyzed by western blot for PMT marker levels or ( C ) assessed for resistance to TMZ. ( D ) LonP1 overexpressing DB76 gliomaspheres were diluted 1:10 with untransformed gliomaspheres prior to reimplantation and immunofluorescence analysis of <t>FOXM1</t> in new organoids. Statistical significance was determined by t-test. * P <0.05, **P <0.01, ***P <0.001; n.s., not significant.
    Monoclonal Mouse Anti Foxm1, supplied by Santa Cruz Biotechnology, used in various techniques. Bioz Stars score: 97/100, based on 1 PubMed citations. ZERO BIAS - scores, article reviews, protocol conditions and more
    https://www.bioz.com/result/monoclonal mouse anti foxm1/product/Santa Cruz Biotechnology
    Average 97 stars, based on 1 article reviews
    monoclonal mouse anti foxm1 - by Bioz Stars, 2026-03
    97/100 stars
      Buy from Supplier

    Image Search Results


    A PGAM1-Chk1 antagonist suppresses FOXM1 during senescence. a , b Assessment of the proapoptotic BH family in SnCs after Nutlin 3b treatment. a RT‒PCR analysis of SnCs with or without Nutlin 3b. ( n = 3, biological replicates). b p53 siRNA-transfected SnCs were exposed to Nutlin 3b. RT‒PCR analysis of the indicated cells. c Knockdown of BIM in SnCs. SnCs were transfected with the indicated siRNA, siBIM, or scramble control RNA. The transfectants were then subjected to Nutlin 3b treatment. d – f Comparison of the results of the microarray analysis between the control and Nutlin 3b-treated SnCs ( n = 3, biological replicates). d Fold enrichment analysis by comparison between 1168 genes downregulated by Nutlin 3b in SnCs and 9442 datasets of chromatin immunoprecipitation (ChIP) information reported in the National Center for Biotechnology Information (NCBI), European Bioinformatics Institute (EBI) and DNA Data Bank of Japan (DDBJ). Eighty-six of the 9442 datasets displayed high enrichment (>3-fold). Twenty-one datasets for FOXM1 are shown in red (left panel). e Heatmap of 37 FOXM1 target genes downregulated by Nutlin 3b. SnCs with or without Nutlin 3b were compared. f Gene expression of the FOX family in SnCs after Nutlin 3b treatment, as determined via microarray data. Left panel, heatmap analysis of the FOX family. Right panel: Red and blue bars indicate reduced and increased expression, respectively. Dagger (†) indicates |FC|≥2 and Lpe. P < 0.05 is presented in Supplementary Fig. . Evaluation of FOXM1 protein levels in SnCs after Nutlin 3b treatment ( g ) and after transfection with HIF-2α siRNA ( h ). The data are representative of two independent experiments. i Evaluation of BIM mRNA in SnCs after FOXM1 knockdown. FOXM1 siRNA was transfected into SnCs ( n = 3, biological replicates). j Schematic diagram of the promoter region in the human BIM gene. Several cis-elements for FKH are shown. The indicated regions were subsequently cloned and inserted into luciferase reporter plasmids (left lower panel). Luciferase reporter assays were performed in SnCs after Nutlin 3b treatment (middle panel). A reporter assay for the proximal region was conducted in SnCs after FOXM1 knockdown (right panel) ( n = 3, biological replicates). The data represent the means ± SEMs. Single (*) and double (**) asterisks indicate statistical significance at p < 0.05 and p < 0.01, respectively. Statistical analyses were performed via unpaired Student’s two-tailed t test ( a ) or one-way analysis of variance (ANOVA) and Dunnett’s multiple comparison test ( b , c , i and j )

    Journal: Signal Transduction and Targeted Therapy

    Article Title: Abrogation of aberrant glycolytic interactions eliminates senescent cells and alleviates aging-related dysfunctions

    doi: 10.1038/s41392-025-02502-6

    Figure Lengend Snippet: A PGAM1-Chk1 antagonist suppresses FOXM1 during senescence. a , b Assessment of the proapoptotic BH family in SnCs after Nutlin 3b treatment. a RT‒PCR analysis of SnCs with or without Nutlin 3b. ( n = 3, biological replicates). b p53 siRNA-transfected SnCs were exposed to Nutlin 3b. RT‒PCR analysis of the indicated cells. c Knockdown of BIM in SnCs. SnCs were transfected with the indicated siRNA, siBIM, or scramble control RNA. The transfectants were then subjected to Nutlin 3b treatment. d – f Comparison of the results of the microarray analysis between the control and Nutlin 3b-treated SnCs ( n = 3, biological replicates). d Fold enrichment analysis by comparison between 1168 genes downregulated by Nutlin 3b in SnCs and 9442 datasets of chromatin immunoprecipitation (ChIP) information reported in the National Center for Biotechnology Information (NCBI), European Bioinformatics Institute (EBI) and DNA Data Bank of Japan (DDBJ). Eighty-six of the 9442 datasets displayed high enrichment (>3-fold). Twenty-one datasets for FOXM1 are shown in red (left panel). e Heatmap of 37 FOXM1 target genes downregulated by Nutlin 3b. SnCs with or without Nutlin 3b were compared. f Gene expression of the FOX family in SnCs after Nutlin 3b treatment, as determined via microarray data. Left panel, heatmap analysis of the FOX family. Right panel: Red and blue bars indicate reduced and increased expression, respectively. Dagger (†) indicates |FC|≥2 and Lpe. P < 0.05 is presented in Supplementary Fig. . Evaluation of FOXM1 protein levels in SnCs after Nutlin 3b treatment ( g ) and after transfection with HIF-2α siRNA ( h ). The data are representative of two independent experiments. i Evaluation of BIM mRNA in SnCs after FOXM1 knockdown. FOXM1 siRNA was transfected into SnCs ( n = 3, biological replicates). j Schematic diagram of the promoter region in the human BIM gene. Several cis-elements for FKH are shown. The indicated regions were subsequently cloned and inserted into luciferase reporter plasmids (left lower panel). Luciferase reporter assays were performed in SnCs after Nutlin 3b treatment (middle panel). A reporter assay for the proximal region was conducted in SnCs after FOXM1 knockdown (right panel) ( n = 3, biological replicates). The data represent the means ± SEMs. Single (*) and double (**) asterisks indicate statistical significance at p < 0.05 and p < 0.01, respectively. Statistical analyses were performed via unpaired Student’s two-tailed t test ( a ) or one-way analysis of variance (ANOVA) and Dunnett’s multiple comparison test ( b , c , i and j )

    Article Snippet: Anti-mouse Chk1 (25887-1-AP, 1:1000) and anti-mouse FOXM1 (13147-1-AP, 1:1000) were purchased from Proteintech (USA).

    Techniques: Transfection, Knockdown, Control, Comparison, Microarray, Chromatin Immunoprecipitation, Gene Expression, Expressing, Clone Assay, Luciferase, Reporter Assay, Two Tailed Test

    In vivo FOXM1 accumulation in aged tissues is targeted by Nutlin 3b. a In vivo profiles of FOXM1 mRNA in several tissues of 4-, 10-, 40- and 90-week-old mice, in addition to embryos on day 13.5. The indicated tissues were collected for RNA extraction. b Fold enrichment analysis comparing upregulated genes in 90-week-old mice (liver: 1039; kidney: 1882; lung: 386; and WAT: 385) and ChIP datasets (liver: 9649; kidney: 11,195; lung: 6147; and WAT: 6059). Comparative transcriptomic analysis of the indicated tissues, liver, lung, kidney, and WAT, was performed between 10-week-old and 90-week-old mice. c Heatmap analysis of FOXM1 target genes in the kidney and lung (left and right panels) of young (10-week-old) and aged (90-week-old) mice. d Assessment of FOXM1 target genes involved in the cell cycle and DNA repair genes in aged kidneys and lungs (upper and lower panels, respectively) after Nutlin 3b treatment via RT‒PCR analysis. Tissues were collected from young (10-week-old), aged (90-week-old) and Nutlin 3b-treated aged mice. e The impact of Nutlin-3b on aged kidneys. Representative pictures of the glomerulus after Nutlin 3b treatment (upper panels). Samples from young, aged and Nutlin 3b-treated aged mice. The bar indicates 50 μm. Hyalinosis scores were assessed in aged mice with or without Nutlin 3b treatment. Glomerulus region (lower left) and interstitial region (lower right). f Immunohistochemical examination of the lung for p21 CIP1 . Representative images of stained samples from the indicated mice are shown (left panels). The bar indicates 20 μm. The ratio of p21 CIP1 -positive cells was assessed (right panel). g Comparison of the mRNA levels of p16 Ink4a and SASP factors (Il6, Tnfα, Cxcl1, and Ccl5). Lung extracts from the indicated mice were analyzed via RT‒PCR. The data represent the means ± SEMs. Single (*) and double (**) asterisks indicate statistical significance at p < 0.05 and p < 0.01, respectively. Statistical analyses were performed via one-way analysis of variance (ANOVA) and Dunnett’s multiple comparison test

    Journal: Signal Transduction and Targeted Therapy

    Article Title: Abrogation of aberrant glycolytic interactions eliminates senescent cells and alleviates aging-related dysfunctions

    doi: 10.1038/s41392-025-02502-6

    Figure Lengend Snippet: In vivo FOXM1 accumulation in aged tissues is targeted by Nutlin 3b. a In vivo profiles of FOXM1 mRNA in several tissues of 4-, 10-, 40- and 90-week-old mice, in addition to embryos on day 13.5. The indicated tissues were collected for RNA extraction. b Fold enrichment analysis comparing upregulated genes in 90-week-old mice (liver: 1039; kidney: 1882; lung: 386; and WAT: 385) and ChIP datasets (liver: 9649; kidney: 11,195; lung: 6147; and WAT: 6059). Comparative transcriptomic analysis of the indicated tissues, liver, lung, kidney, and WAT, was performed between 10-week-old and 90-week-old mice. c Heatmap analysis of FOXM1 target genes in the kidney and lung (left and right panels) of young (10-week-old) and aged (90-week-old) mice. d Assessment of FOXM1 target genes involved in the cell cycle and DNA repair genes in aged kidneys and lungs (upper and lower panels, respectively) after Nutlin 3b treatment via RT‒PCR analysis. Tissues were collected from young (10-week-old), aged (90-week-old) and Nutlin 3b-treated aged mice. e The impact of Nutlin-3b on aged kidneys. Representative pictures of the glomerulus after Nutlin 3b treatment (upper panels). Samples from young, aged and Nutlin 3b-treated aged mice. The bar indicates 50 μm. Hyalinosis scores were assessed in aged mice with or without Nutlin 3b treatment. Glomerulus region (lower left) and interstitial region (lower right). f Immunohistochemical examination of the lung for p21 CIP1 . Representative images of stained samples from the indicated mice are shown (left panels). The bar indicates 20 μm. The ratio of p21 CIP1 -positive cells was assessed (right panel). g Comparison of the mRNA levels of p16 Ink4a and SASP factors (Il6, Tnfα, Cxcl1, and Ccl5). Lung extracts from the indicated mice were analyzed via RT‒PCR. The data represent the means ± SEMs. Single (*) and double (**) asterisks indicate statistical significance at p < 0.05 and p < 0.01, respectively. Statistical analyses were performed via one-way analysis of variance (ANOVA) and Dunnett’s multiple comparison test

    Article Snippet: Anti-mouse Chk1 (25887-1-AP, 1:1000) and anti-mouse FOXM1 (13147-1-AP, 1:1000) were purchased from Proteintech (USA).

    Techniques: In Vivo, RNA Extraction, Immunohistochemical staining, Staining, Comparison

    FIGURE 1 SIRT2 and FOXM1 immunostaining and correlation in human colon cancer. (A) Representation images of the strong, moderate, and weak SIRT2 (upper panel) and FOXM1 (lower panel) staining of colon tissue sections from the same tumors were presented. Samples were counterstained with hematoxylin and scored semi‐quantifiably according to staining intensities. Bar = 100 μm. *Independent‐Samples t‐test, **Pearson Chi‐Square. (B) Correlation between SIRT2 and FOXM1 gene expressions. Gene expressions were obtained from TCGA‐COAD Project Database and correlation was analyzed with Spearman's rho. A negative Spearman correlation (−0.3084) was found between the genes (p < 0.001).

    Journal: Journal of biochemical and molecular toxicology

    Article Title: SIRT2 deacetylates and decreases the expression of FOXM1 in colon cancer.

    doi: 10.1002/jbt.70018

    Figure Lengend Snippet: FIGURE 1 SIRT2 and FOXM1 immunostaining and correlation in human colon cancer. (A) Representation images of the strong, moderate, and weak SIRT2 (upper panel) and FOXM1 (lower panel) staining of colon tissue sections from the same tumors were presented. Samples were counterstained with hematoxylin and scored semi‐quantifiably according to staining intensities. Bar = 100 μm. *Independent‐Samples t‐test, **Pearson Chi‐Square. (B) Correlation between SIRT2 and FOXM1 gene expressions. Gene expressions were obtained from TCGA‐COAD Project Database and correlation was analyzed with Spearman's rho. A negative Spearman correlation (−0.3084) was found between the genes (p < 0.001).

    Article Snippet: Sections were incubated with rabbit polyclonal SIRT2 (Sigma, St. Louis, MO, USA) or FOXM1 mouse monoclonal antibodies (Santa Cruz Biotechnology, CA, USA) at 1:50 dilutions overnight at 4°C.

    Techniques: Immunostaining, Staining

    FIGURE 2 (A) 40 μg protein lysates from FET, HCT116 p21−/−, HCT116, SW480, SW620, and Caco2 colon carcinoma cells were separated and subsequently immunoblotted with anti‐FOXM1, anti‐SIRT2, and anti‐β‐actin antibodies. (B) Quantification of protein band intensity was performed by ImageJ software. Bars are the mean ± S.D. Games–Howell posthoc: ab, ac, ae, ef, a′b′, a′c′, a′d′, a′e′, a′f′, b′c′, b′d′, c′e′, c′f′, d′e′, d′f′, e′f′ p < 0.05. (C–E) Stably SIRT2 overexpressing and control colon cancer (C) FET, (D) SW620, and (E) HCT116 were separated and subsequently immunoblotted with anti‐FOXM1, anti‐SIRT2, and anti‐GAPDH antibodies.

    Journal: Journal of biochemical and molecular toxicology

    Article Title: SIRT2 deacetylates and decreases the expression of FOXM1 in colon cancer.

    doi: 10.1002/jbt.70018

    Figure Lengend Snippet: FIGURE 2 (A) 40 μg protein lysates from FET, HCT116 p21−/−, HCT116, SW480, SW620, and Caco2 colon carcinoma cells were separated and subsequently immunoblotted with anti‐FOXM1, anti‐SIRT2, and anti‐β‐actin antibodies. (B) Quantification of protein band intensity was performed by ImageJ software. Bars are the mean ± S.D. Games–Howell posthoc: ab, ac, ae, ef, a′b′, a′c′, a′d′, a′e′, a′f′, b′c′, b′d′, c′e′, c′f′, d′e′, d′f′, e′f′ p < 0.05. (C–E) Stably SIRT2 overexpressing and control colon cancer (C) FET, (D) SW620, and (E) HCT116 were separated and subsequently immunoblotted with anti‐FOXM1, anti‐SIRT2, and anti‐GAPDH antibodies.

    Article Snippet: Sections were incubated with rabbit polyclonal SIRT2 (Sigma, St. Louis, MO, USA) or FOXM1 mouse monoclonal antibodies (Santa Cruz Biotechnology, CA, USA) at 1:50 dilutions overnight at 4°C.

    Techniques: Software, Stable Transfection, Control

    FIGURE 3 SIRT2 interacted with FOXM1. (A–D) Subcellular localization of SIRT2 and FOXM1 proteins in human colorectal cancer line HCT116. (A) SIRT2; (B) FOXM1; (C) DAPI; (D) image obtained by overlapping layers. Green channel: SIRT2, red channel: FOXM1, blue channel: DAPI. (E) 293T cells were transfected with 5 μg Flag‐SIRT2 followed by immunoprecipitation of 1 mg total protein lysate with an anti‐Flag antibody. Isolated samples were separated and subsequently immunoblotted with an anti‐FOXM1 antibody. (F) SIRT2 protein was immunoprecipitated with an anti‐SIRT2 antibody from 1 mg total protein lysate of HCT116 cells. Anti‐IgG IP from the same amount of protein lysate was used as a negative control. Input immune blotted is shown as a positive control.

    Journal: Journal of biochemical and molecular toxicology

    Article Title: SIRT2 deacetylates and decreases the expression of FOXM1 in colon cancer.

    doi: 10.1002/jbt.70018

    Figure Lengend Snippet: FIGURE 3 SIRT2 interacted with FOXM1. (A–D) Subcellular localization of SIRT2 and FOXM1 proteins in human colorectal cancer line HCT116. (A) SIRT2; (B) FOXM1; (C) DAPI; (D) image obtained by overlapping layers. Green channel: SIRT2, red channel: FOXM1, blue channel: DAPI. (E) 293T cells were transfected with 5 μg Flag‐SIRT2 followed by immunoprecipitation of 1 mg total protein lysate with an anti‐Flag antibody. Isolated samples were separated and subsequently immunoblotted with an anti‐FOXM1 antibody. (F) SIRT2 protein was immunoprecipitated with an anti‐SIRT2 antibody from 1 mg total protein lysate of HCT116 cells. Anti‐IgG IP from the same amount of protein lysate was used as a negative control. Input immune blotted is shown as a positive control.

    Article Snippet: Sections were incubated with rabbit polyclonal SIRT2 (Sigma, St. Louis, MO, USA) or FOXM1 mouse monoclonal antibodies (Santa Cruz Biotechnology, CA, USA) at 1:50 dilutions overnight at 4°C.

    Techniques: Transfection, Immunoprecipitation, Isolation, Negative Control, Positive Control

    FIGURE 5 Effects of SIRT activators and inhibitors on FOXM1 and SIRT2 protein expressions. HCT116 cells were seeded in sterile petri dishes at a cell count of approximately 106 and allowed to reach approximately 60–70% for approximately 24 h. Resveratrol (100 μM), melatonin (2 mM), berberine (50 μm), quercetin (100 μM), honokiol (10 μM), SRT1720 (5 μM), EX527 (100 μM), AGK2 (10 μM) and SirReal2 (100 μM) were added to the medium containing the cells and exposed for 24 h. Protein extracts were prepared, separated, and immunoblotted with anti‐FOXM1 and anti‐SIRT2 and anti‐β‐actin antibodies as described in the materials and methods section. The experiment was repeated at least three times. Bars are the mean ± S.D. Games–Howell posthoc: ae, ag, aj, bh, bi, cg, cj, dh, ef, ej, fj, gj, hj, ij p < 0.05, ad, af, bg, bj, cd, ce, cf, de, df, di p < 0.01, ab, bc, be, bf, dg, dj p < 0.001.

    Journal: Journal of biochemical and molecular toxicology

    Article Title: SIRT2 deacetylates and decreases the expression of FOXM1 in colon cancer.

    doi: 10.1002/jbt.70018

    Figure Lengend Snippet: FIGURE 5 Effects of SIRT activators and inhibitors on FOXM1 and SIRT2 protein expressions. HCT116 cells were seeded in sterile petri dishes at a cell count of approximately 106 and allowed to reach approximately 60–70% for approximately 24 h. Resveratrol (100 μM), melatonin (2 mM), berberine (50 μm), quercetin (100 μM), honokiol (10 μM), SRT1720 (5 μM), EX527 (100 μM), AGK2 (10 μM) and SirReal2 (100 μM) were added to the medium containing the cells and exposed for 24 h. Protein extracts were prepared, separated, and immunoblotted with anti‐FOXM1 and anti‐SIRT2 and anti‐β‐actin antibodies as described in the materials and methods section. The experiment was repeated at least three times. Bars are the mean ± S.D. Games–Howell posthoc: ae, ag, aj, bh, bi, cg, cj, dh, ef, ej, fj, gj, hj, ij p < 0.05, ad, af, bg, bj, cd, ce, cf, de, df, di p < 0.01, ab, bc, be, bf, dg, dj p < 0.001.

    Article Snippet: Sections were incubated with rabbit polyclonal SIRT2 (Sigma, St. Louis, MO, USA) or FOXM1 mouse monoclonal antibodies (Santa Cruz Biotechnology, CA, USA) at 1:50 dilutions overnight at 4°C.

    Techniques: Sterility, Cell Counting

    FIGURE 4 FOXM1 could be hyperacetylated and SIRT2 deacetylated FOXM1. (A) 293T cells were transfected with 5 μg FOXM1 and 2 μg of each HAT (p300 and pCAF) and 48 h after transfection, cell extracts were immunoprecipitated with an anti‐FOXM1 antibody, separated and subsequently immunoblotted with anti‐SIRT2 and anti‐FOXM1 antibodies. (B) Purified acetylated FOXM1 was mixed with purified SIRT2, without or with NAD+, and samples were immunoblotted with anti‐acetyl‐lysine and anti‐FOXM1 antibodies. Input immune blotted is shown as a positive control.

    Journal: Journal of biochemical and molecular toxicology

    Article Title: SIRT2 deacetylates and decreases the expression of FOXM1 in colon cancer.

    doi: 10.1002/jbt.70018

    Figure Lengend Snippet: FIGURE 4 FOXM1 could be hyperacetylated and SIRT2 deacetylated FOXM1. (A) 293T cells were transfected with 5 μg FOXM1 and 2 μg of each HAT (p300 and pCAF) and 48 h after transfection, cell extracts were immunoprecipitated with an anti‐FOXM1 antibody, separated and subsequently immunoblotted with anti‐SIRT2 and anti‐FOXM1 antibodies. (B) Purified acetylated FOXM1 was mixed with purified SIRT2, without or with NAD+, and samples were immunoblotted with anti‐acetyl‐lysine and anti‐FOXM1 antibodies. Input immune blotted is shown as a positive control.

    Article Snippet: Sections were incubated with rabbit polyclonal SIRT2 (Sigma, St. Louis, MO, USA) or FOXM1 mouse monoclonal antibodies (Santa Cruz Biotechnology, CA, USA) at 1:50 dilutions overnight at 4°C.

    Techniques: Transfection, Immunoprecipitation, Purification, Positive Control

    (A) Quantitative RT-PCR of Foxm1 mRNA in AtT-20 cells treated with 2 μM TS for 24 h. n = 6 each. (B, C) Quantitative RT-PCR of Foxm1 mRNA (B) and cell viability (C) of AtT-20 cells with Foxm1 knockdown (KD) by transfection with short interfering RNA (siRNA). A negative control siRNA (si N/C) was used, along with two siRNAs for Foxm1 (si Foxm1 #1 and si Foxm1 #2). RNA samples were collected after 24 h and cell viability was evaluated at both 24 and 48 h after transfections. Results are shown as the ratio relative to si N/C at 24 h. n = 6 each. (D, E) Quantitative RT-PCR of Foxm1 mRNA (D) and cell viability (E) of AtT-20 cells treated with TS and/or with Foxm1 knockdown. The Control group was treated with vehicle and transfected with si N/C, the TS group with 2 μM TS and si N/C, and the Foxm1 KD group with vehicle and si Foxm1 #2. n = 6 each. (F–H) Results of RNA-sequencing (RNA-seq) using RNA samples obtained in the experiments shown in panels D and E. Samples were analyzed as a mix of every two samples. n = 3 each. Panels F–H show hierarchical clustering (F), the top 20 terms from the enrichment analysis by the Kyoto Encyclopedia of Genes and Genomes (KEGG) (G), and DEGs associated with the cell cycle pathway in KEGG (H). DEGs were determined as an adjusted p < 0.05 and fold changes ≤ −2 or ≥ 2. Data of quantitative RT-PCR are normalized by means of Actb and Gapdh . Data are represented as means ± SEM. Statistical analyses were performed using the Student’s t -test for a panel A, and ANOVA followed by the Tukey-Kramer test for panels B–E. The p -value is presented as * p < 0.05, ** p < 0.01, and *** p < 0.001.

    Journal: bioRxiv

    Article Title: High-throughput screening for Cushing’s disease: therapeutic potential of thiostrepton via cell cycle regulation

    doi: 10.1101/2024.02.22.581351

    Figure Lengend Snippet: (A) Quantitative RT-PCR of Foxm1 mRNA in AtT-20 cells treated with 2 μM TS for 24 h. n = 6 each. (B, C) Quantitative RT-PCR of Foxm1 mRNA (B) and cell viability (C) of AtT-20 cells with Foxm1 knockdown (KD) by transfection with short interfering RNA (siRNA). A negative control siRNA (si N/C) was used, along with two siRNAs for Foxm1 (si Foxm1 #1 and si Foxm1 #2). RNA samples were collected after 24 h and cell viability was evaluated at both 24 and 48 h after transfections. Results are shown as the ratio relative to si N/C at 24 h. n = 6 each. (D, E) Quantitative RT-PCR of Foxm1 mRNA (D) and cell viability (E) of AtT-20 cells treated with TS and/or with Foxm1 knockdown. The Control group was treated with vehicle and transfected with si N/C, the TS group with 2 μM TS and si N/C, and the Foxm1 KD group with vehicle and si Foxm1 #2. n = 6 each. (F–H) Results of RNA-sequencing (RNA-seq) using RNA samples obtained in the experiments shown in panels D and E. Samples were analyzed as a mix of every two samples. n = 3 each. Panels F–H show hierarchical clustering (F), the top 20 terms from the enrichment analysis by the Kyoto Encyclopedia of Genes and Genomes (KEGG) (G), and DEGs associated with the cell cycle pathway in KEGG (H). DEGs were determined as an adjusted p < 0.05 and fold changes ≤ −2 or ≥ 2. Data of quantitative RT-PCR are normalized by means of Actb and Gapdh . Data are represented as means ± SEM. Statistical analyses were performed using the Student’s t -test for a panel A, and ANOVA followed by the Tukey-Kramer test for panels B–E. The p -value is presented as * p < 0.05, ** p < 0.01, and *** p < 0.001.

    Article Snippet: The primary antibodies used were a mouse monoclonal anti-FOXM1 antibody (1:500, sc-376471; Santa Cruz Biotechnology, Dallas, TX), and a mouse monoclonal antibody anti–β-actin antibody (1:2000, 010-27841; FUJIFILM Wako Pure Chemical, Osaka, Japan) as an endogenous control.

    Techniques: Quantitative RT-PCR, Knockdown, Transfection, Small Interfering RNA, Negative Control, Control, RNA Sequencing

    (A, B) Gene expression levels of cyclins in the Control, TS, and Foxm1 KD groups. Data are represented as transcript per kilobase million (TPM) for RNA-seq (A), and as relative expression levels compared to the Control group for quantitative RT-PCR (B). n = 3 for each group in panel A, and n = 6 for each group in panel B. (C–F) Cell cycle analyses using propidium iodide (PI) staining and flow cytometry for AtT-20 cells treated with TS (0, 2, and 4 μM) for 24 h. n = 6 each. (G–J) Evaluation of apoptosis using staining with Annexin V-FITC and PI and flow cytometry for AtT-20 cells treated with TS (0, 2, and 4 μM) for 48 h. n = 3 each. (K–M) Cell cycle analyses using PI staining and flow cytometry for AtT-20 cells treated with 5 μM palbociclib for 24 h. n = 6 each. (N) Cell viability of AtT-20 cells treated with a dilution series of palbociclib. Either vehicle or 2 μM TS was co-administered with palbociclib and analysis was performed after 48 h. Results are shown as the ratio relative to values without palbociclib and TS. n = 6 each. Data of quantitative RT-PCR are normalized by means of Actb and Gapdh . Data are represented as means ± SEM. Statistical analyses were performed using ANOVA followed by the Tukey-Kramer test for panels A, B, F, and J, the Student’s t -test for panel M, and ANOVA followed by the Dunnett test with comparisons to results without palbociclib administration for panel N. The p -value is presented as * p < 0.05, ** p < 0.01, and *** p < 0.001.

    Journal: bioRxiv

    Article Title: High-throughput screening for Cushing’s disease: therapeutic potential of thiostrepton via cell cycle regulation

    doi: 10.1101/2024.02.22.581351

    Figure Lengend Snippet: (A, B) Gene expression levels of cyclins in the Control, TS, and Foxm1 KD groups. Data are represented as transcript per kilobase million (TPM) for RNA-seq (A), and as relative expression levels compared to the Control group for quantitative RT-PCR (B). n = 3 for each group in panel A, and n = 6 for each group in panel B. (C–F) Cell cycle analyses using propidium iodide (PI) staining and flow cytometry for AtT-20 cells treated with TS (0, 2, and 4 μM) for 24 h. n = 6 each. (G–J) Evaluation of apoptosis using staining with Annexin V-FITC and PI and flow cytometry for AtT-20 cells treated with TS (0, 2, and 4 μM) for 48 h. n = 3 each. (K–M) Cell cycle analyses using PI staining and flow cytometry for AtT-20 cells treated with 5 μM palbociclib for 24 h. n = 6 each. (N) Cell viability of AtT-20 cells treated with a dilution series of palbociclib. Either vehicle or 2 μM TS was co-administered with palbociclib and analysis was performed after 48 h. Results are shown as the ratio relative to values without palbociclib and TS. n = 6 each. Data of quantitative RT-PCR are normalized by means of Actb and Gapdh . Data are represented as means ± SEM. Statistical analyses were performed using ANOVA followed by the Tukey-Kramer test for panels A, B, F, and J, the Student’s t -test for panel M, and ANOVA followed by the Dunnett test with comparisons to results without palbociclib administration for panel N. The p -value is presented as * p < 0.05, ** p < 0.01, and *** p < 0.001.

    Article Snippet: The primary antibodies used were a mouse monoclonal anti-FOXM1 antibody (1:500, sc-376471; Santa Cruz Biotechnology, Dallas, TX), and a mouse monoclonal antibody anti–β-actin antibody (1:2000, 010-27841; FUJIFILM Wako Pure Chemical, Osaka, Japan) as an endogenous control.

    Techniques: Gene Expression, Control, RNA Sequencing, Expressing, Quantitative RT-PCR, Staining, Flow Cytometry

    ( A ) Diagram highlighting how gliomaspheres were isolated and transformed for analysis and also reimplanted using a 1:10 dilution into fresh organoids. ( B ) Gliomaspheres and organoid fractions isolated ± LonP1 overexpression were analyzed by western blot for PMT marker levels or ( C ) assessed for resistance to TMZ. ( D ) LonP1 overexpressing DB76 gliomaspheres were diluted 1:10 with untransformed gliomaspheres prior to reimplantation and immunofluorescence analysis of FOXM1 in new organoids. Statistical significance was determined by t-test. * P <0.05, **P <0.01, ***P <0.001; n.s., not significant.

    Journal: bioRxiv

    Article Title: LonP1 Drives Proneural Mesenchymal Transition in IDH1-R132H Diffuse Glioma

    doi: 10.1101/2023.04.13.536817

    Figure Lengend Snippet: ( A ) Diagram highlighting how gliomaspheres were isolated and transformed for analysis and also reimplanted using a 1:10 dilution into fresh organoids. ( B ) Gliomaspheres and organoid fractions isolated ± LonP1 overexpression were analyzed by western blot for PMT marker levels or ( C ) assessed for resistance to TMZ. ( D ) LonP1 overexpressing DB76 gliomaspheres were diluted 1:10 with untransformed gliomaspheres prior to reimplantation and immunofluorescence analysis of FOXM1 in new organoids. Statistical significance was determined by t-test. * P <0.05, **P <0.01, ***P <0.001; n.s., not significant.

    Article Snippet: Mounted slides were stored at −20 C. Individual slides were blocked with 10% donkey serum, 0.1% triton in 1X TBS for 1 hour, then stained overnight at 4 C using the Mouse anti-FOXM1 antibody (Sigma, SAB141225412254-100UG) in blocking solution.

    Techniques: Isolation, Transformation Assay, Over Expression, Western Blot, Marker, Immunofluorescence